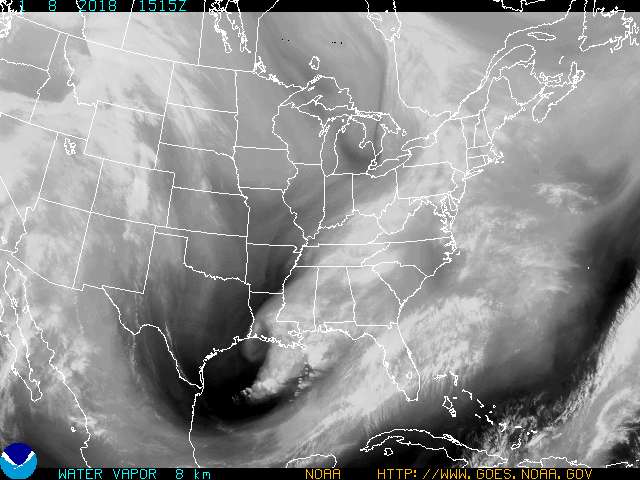
This Image shows the density of water vapor in the atmosphere. The darker the clouds the more water vapor. This can be a handy image to predict rain because the more water vapor, the heavier the cloud, the greater chance for rain.
This is one of my favorite images because it breaks down the hundreds of weather stations' data into something I can understand. It can show all kinds of weather effects although non are really present on the day this one was taken, just clouds. The forecast potential is high because of all the data it shows such as pressure.
The chart of the current pressure for a day is a handy tool in weather forecasting because it doesn't just tell you a fixed number like the weather stations but shows you the trend, which is vastly more important. With this trend I can see that the pressure is decreasing, albeit not by very much. If this was decreasing at a more rapid rate I would say we were in from some bad weather, but for now I'd go with a chance for some light showers, a small chance.
The doppler radar map accurately shows clouds, current precipitation, and their movement in real time. The reason I chose this specific image is that there is nothing going on, not even a tumbleweed blowing across and empty parking lot where one child is playing with cowboy dolls action figures ready to have a duel with Dirty Dan.


No comments:
Post a Comment